
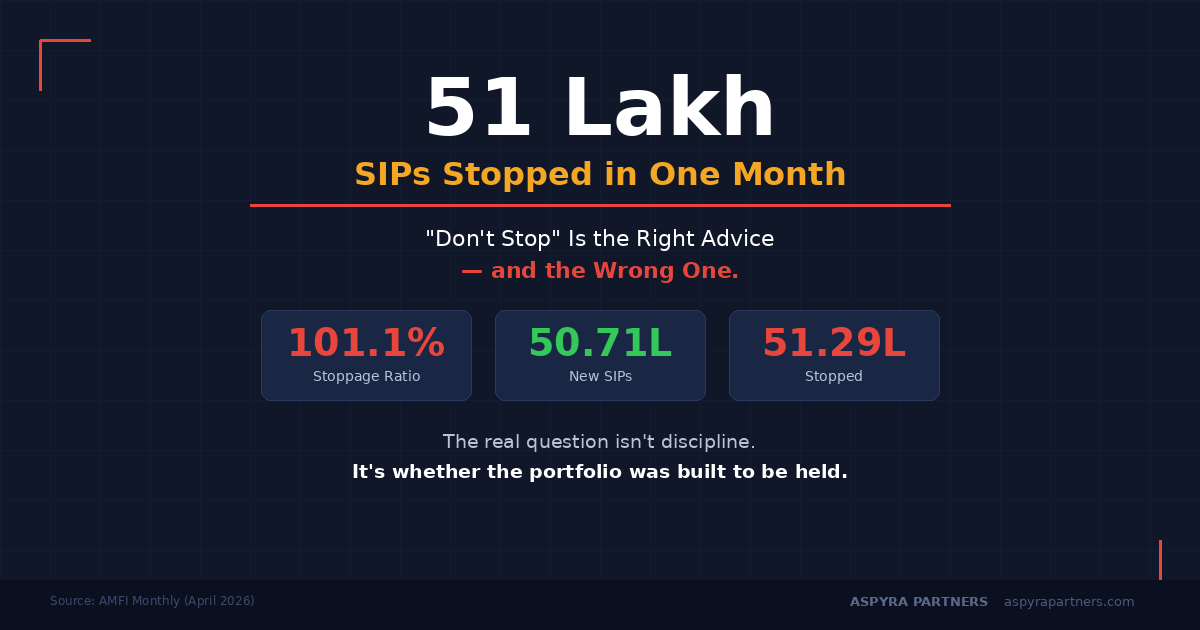
51 Lakh SIPs Stopped in One Month. "Don't Stop" Is the Right Advice — and the Wrong One.
By Sandeep Handa | Co-Founder, Aspyra Partners
For the second straight month, more SIPs died than were born. April's numbers: 51.29 lakh stopped, only 50.71 lakh new ones registered. The net SIP count in India is shrinking.
Every financial voice on the internet is saying the same thing right now: don't stop your SIP. And they're right. Stopping a SIP during a market correction is mathematically one of the most expensive mistakes a retail investor can make. SIPs during downturns buy more units at lower prices. When markets recover — and they have, every single time in Indian market history — those cheaper units are what drive your returns.
The math is clear. The advice is correct.
But it's answering the wrong question.
The question nobody is asking
51 lakh investors didn't stop their SIPs because they failed a math test. They stopped because something broke.
Think about it. These are people who went through the effort of selecting a fund, setting up a mandate, and committing to monthly deductions from their salary. They had the discipline to start. What they didn't have was a portfolio that prepared them for what a correction actually feels like.
Markets have delivered nearly flat returns over the past 18 months. Nifty 50 touched lifetime highs in September 2024, then corrected over 14% from that peak. Many mid-cap and small-cap funds fell 20-30%. And those 51 lakh investors opened their apps, saw months of red, and made a decision that the entire internet is now calling "wrong."
But was it really a discipline failure? Or was it a design failure?
What "don't stop" doesn't fix
Here's what the "don't stop your SIP" advice assumes: that the investor's portfolio was correctly built in the first place. That the fund selection matched their actual risk appetite — not the risk appetite they claimed on a 5-question quiz, but the risk they can actually stomach when their portfolio is down 15% for six months straight.
That assumption is almost never true.
When we X-ray portfolios — over 500 at this point — we find the same structural pattern in 9 out of 10:
-
False diversification. The investor holds 6-8 funds thinking they're diversified. Under the hood, 4 of those funds hold the same top 15 stocks. When the market falls, everything falls together. The investor expected diversification to cushion the blow. It didn't — because there was no real diversification to begin with.
-
Risk mismatch. The investor chose "aggressive" funds because the 3-year returns looked impressive. Nobody showed them what aggressive actually means: -21% drawdowns that take 600+ days to recover. When the drawdown arrived, it felt like a crisis — not like the expected cost of higher returns.
-
No architecture, just materials. The portfolio was built by picking "good funds" from a top-10 list. Nobody checked how those funds behave together under stress. It's like building a house with expensive bricks but no foundation — it looks great until the earthquake hits.
These aren't rare edge cases. This is the default Indian retail portfolio. And when a portfolio with these structural problems meets a market correction, "don't stop" isn't enough — because the investor's lived experience is genuinely worse than it needed to be.
The data behind the panic
AMFI's April 2026 numbers tell a story beyond the headline:
- 51.29 lakh SIPs stopped or completed against 50.71 lakh new registrations — a stoppage ratio of 101.1% (source: AMFI Monthly)
- This is the second consecutive month where more SIPs were closed than opened
- Yet total SIP inflows held at ₹31,115 crore — meaning the investors who stayed are investing more
- SIP AUM stands at ₹16.85 lakh crore, or 20.6% of the mutual fund industry's total AUM
Read those numbers together. The people who stayed are committed. The people who left were — structurally — not prepared.
This is the split that "don't stop your SIP" doesn't address. Some investors have portfolios built for the journey. Their corrections feel like temporary discomfort — expected, planned for, recoverable. Other investors have portfolios that amplify corrections — deeper falls, longer recovery, more months of red. For them, stopping the SIP isn't irrational. It's the predictable outcome of a portfolio that was never stress-tested.
The real leak: portfolios that weren't built to be held
This is what we call the silent leak. Your portfolio might be delivering "okay" returns in a rising market — so you never notice the problem. But the structural weaknesses are compounding quietly:
- Overlapping funds that concentrate risk instead of spreading it
- No asset-class diversification — 100% equity means 100% of your portfolio falls together
- Funds selected on past returns, not on drawdown behaviour
- No understanding of what a -15% correction looks like on YOUR specific portfolio
The leak doesn't announce itself. It surfaces only when markets fall — and by then, the damage is done. The investor panics, stops the SIP, and breaks the compounding chain. Not because they lacked discipline, but because the portfolio broke them first.
Compounding only works when you stay invested. And you can only stay invested when your portfolio doesn't scare you out.
The 51 lakh investors who stopped weren't weak. Their portfolios were.
Is your portfolio built for this?
If three or more of these are true, your portfolio shares the structural pattern behind those 51 lakh stoppages:
- You've felt the urge to pause or reduce a SIP during this correction — even briefly
- Your entire portfolio went red during the recent fall, with nothing moving in the other direction
- You don't know your portfolio's maximum drawdown or how long it took to recover from past corrections
- You chose your funds based on 3-year or 5-year return rankings
- Your "risk profile" was set by a short quiz, not by stress-testing your actual holdings against real market crashes
- Nobody has ever shown you how your funds behave together under stress — not just individually
If you're nodding at two or three of these, your portfolio likely has the same silent leak that turned 51 lakh SIPs into stoppages.
What a Portfolio X-Ray actually checks
This is exactly what our Portfolio X-Ray diagnoses. Not which funds are "good" or "bad" — but whether the structure underneath can survive a bad year without breaking you.
We look at what your app doesn't show you: drawdown depth, recovery time, fund overlap, risk-adjusted returns, and whether your portfolio's pain level matches what you can actually hold through.
Free Portfolio X-Ray — 20 minutes, no sales pitch, just diagnostics.
aspyrapartners.com/portfolio-xray
Mutual Fund investments are subject to market risks, read all scheme related documents carefully. All portfolio analysis references are based on historical data and proprietary models. Past performance is not indicative of future returns. Aspyra Partners L.L.P. — AMFI-Registered Mutual Fund Distributor (ARN-343632).
Data sources: AMFI Monthly (April 2026), IMP.NEWS